Graph It
In this puzzle, we are presented with a list of numbers preceded by the text "y=". The title implies that we should be graphing something, so we can interpret these as y-coordinates, but for what? The flavor is also self-referential; searching for the keywords "self-referential graph" or "960939379" leads us to Tupper's self-referential formula, and the y-value used in this formula is exactly the first y-value in this puzzle.
Strictly speaking, this formula is not self-referential but rather contains every possible bitmap at some location in the plane. This puzzle is about graphs that can encode data into the y-value.
If we take the second number starting with "216" and graph the same plot starting at this y-value, we get a new, very similar formula. Repeating this step and graphing the formula from each number starting at the next y-value eventually results in a final graph.
Some things to note when graphing:
- As the x and y-axes are plotted as flipped in Tupper's formula, we should take care to do the same for all the plots.
- The numbers are very large; we need to use a tool or programming language datatype (Python ints, for example) that can handle arbitrarily large integers.
- In the last graph, x and y are no longer floored so we need to include real-valued coordinates to get a full resolution picture.
Here are the formulas obtained from each number, along with the relevant parts of the graphs and some notes about plotting them.
The first formula
This is Tupper's self-referential formula. This formula fills each square or not depending on each bit of y divided by 17, from lowest to highest. The lowest 17 bits are placed at x=0, the next lowest 17 bits are placed at x=1, and so on.
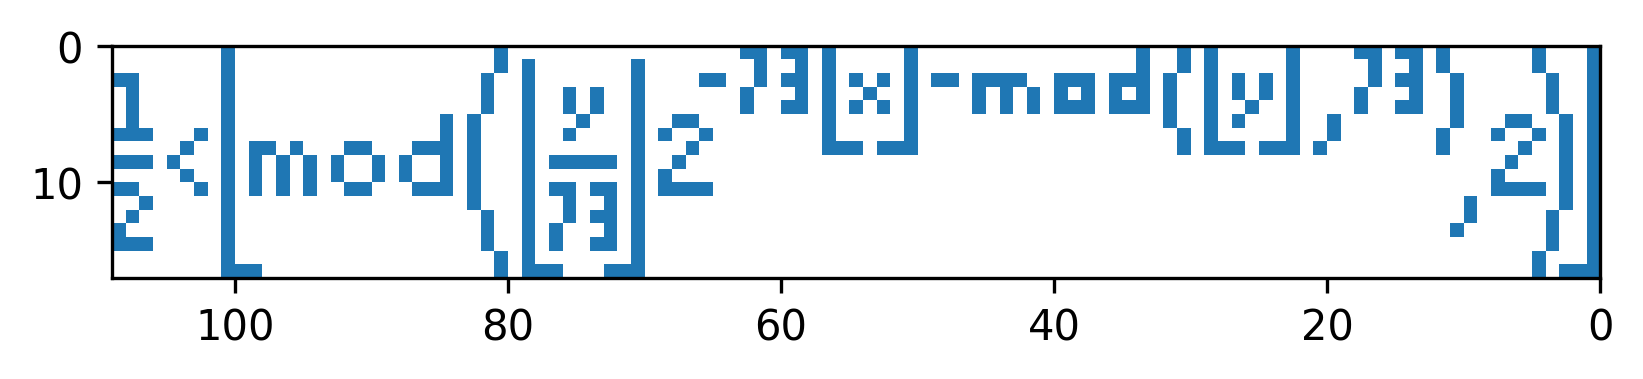
The second formula
This formula is almost the same. Since it plots y divided by 73, 73 bits at a time, we will need to change our graphing window to a height of 73.
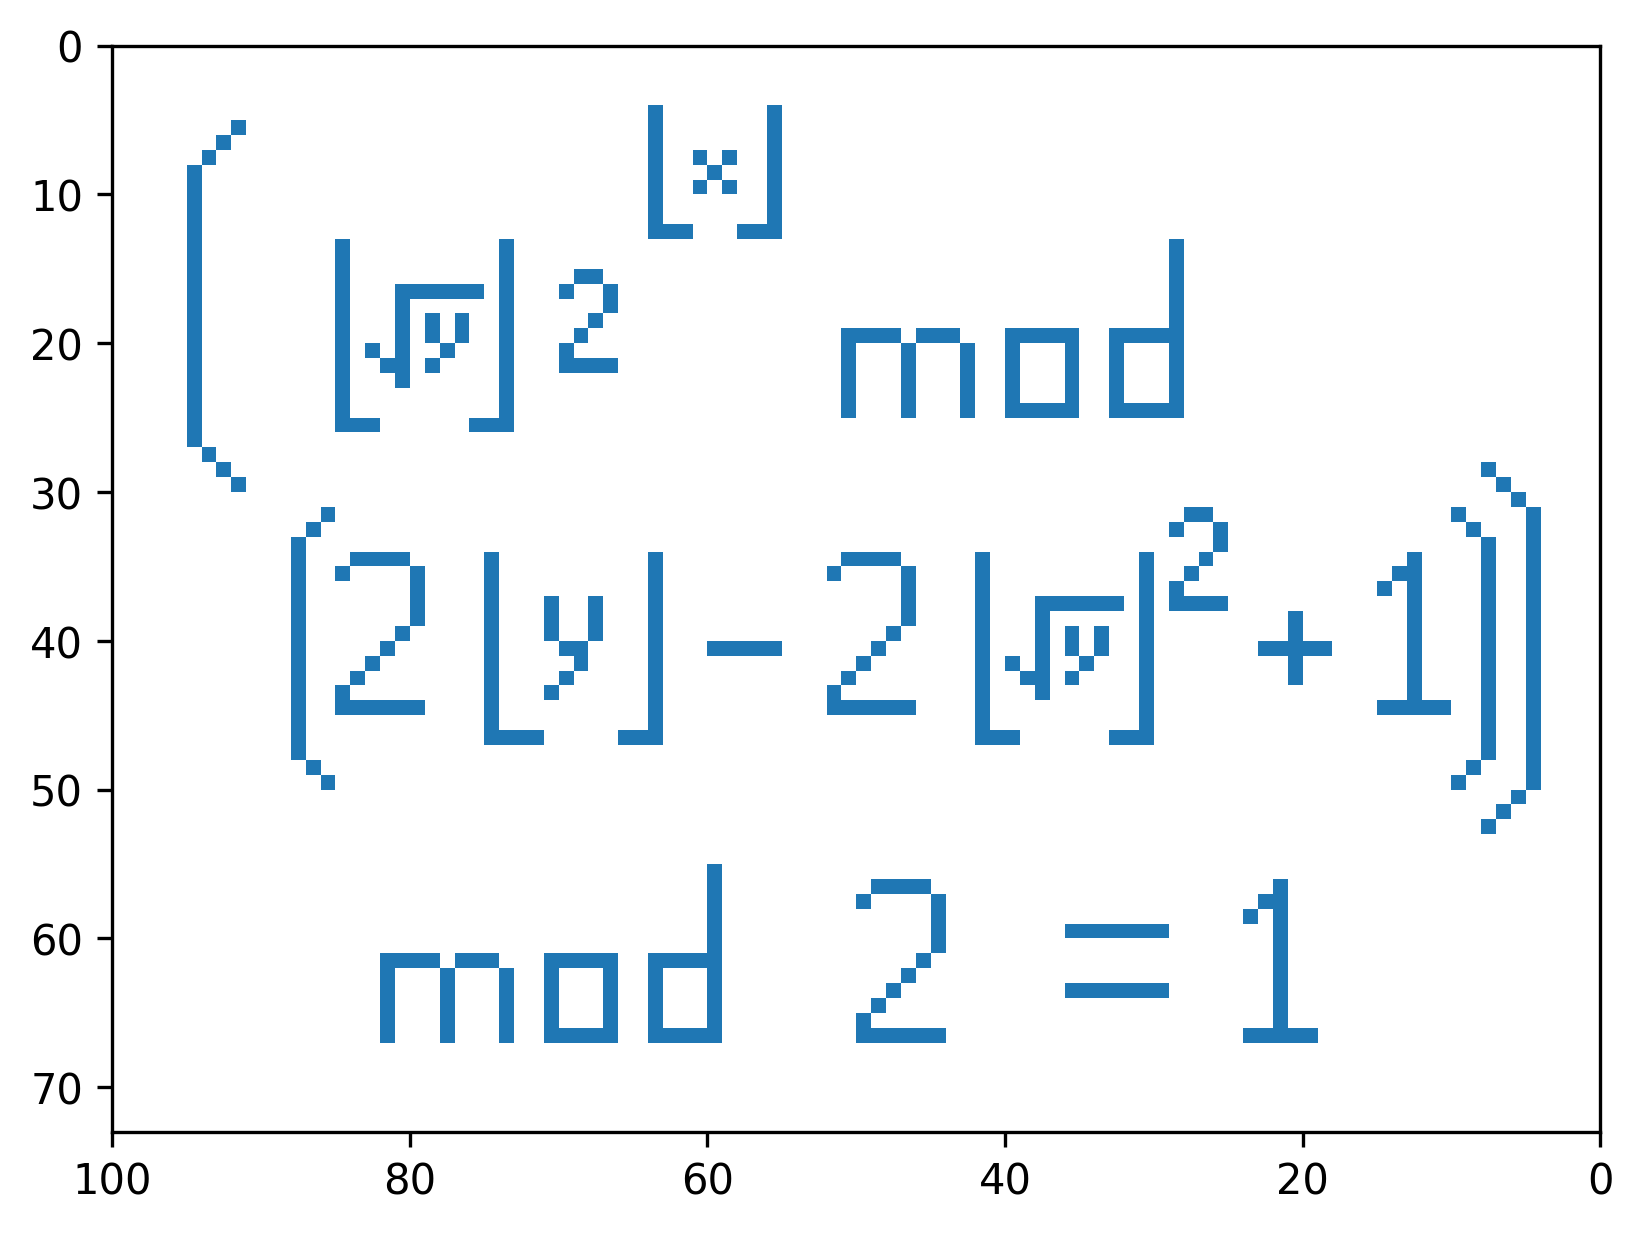
The third formula
This formula again plots white or black squares as it only takes into account the integer part of x and y. The y-coordinate is separated into two parts: the integer square root of y (let's call this k) and the leftovers, y - k^2. For the given y value, the leftovers happens to be exactly 5000000000000000000000000000000000000000000000000000000000000000000000000000000000000000000000000000000000000000 (5 * 10^111), which can confirm that we're on the right track. We need to plot k * 2^⌊x⌋ modulo odd numbers starting from 10^112 + 1, then look at the parity to decide whether to fill each square or not. Since this formula does not give any clues on the size of the graphing window, we can try different heights, and arrive at height 46 and width 337. Looking outside this window gives essentially random bits.
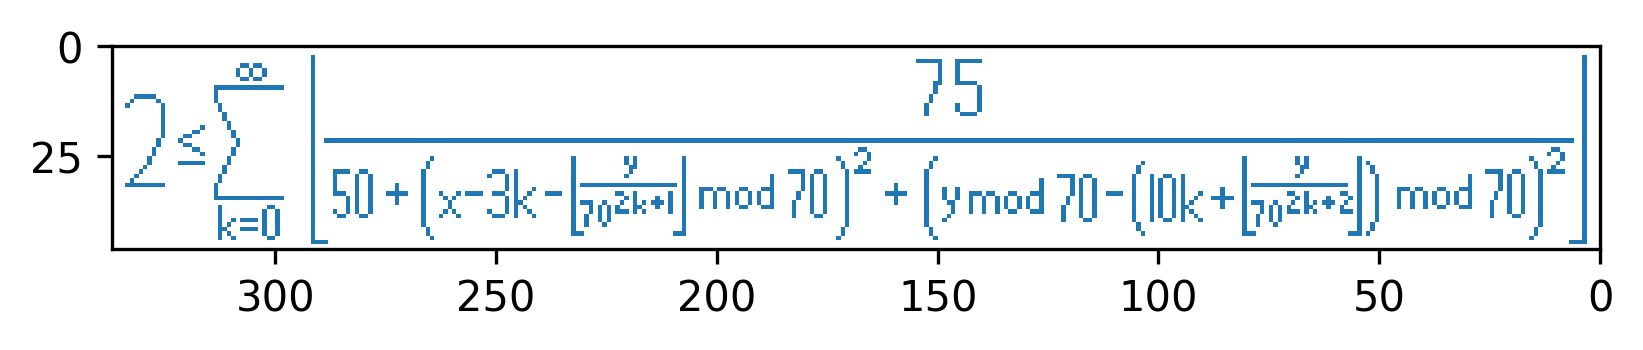
The fourth and final formula
As the given y value is a multiple of 70 and is taken modulo 70 in the formula, this suggests that our graphing window should have height 70. If we look closer at what is happening in the formula, we notice that we are writing y in base 70 and taking pairs of digits to get x and y coordinates. For each integer k, the set of points where the summand is 1 is the interior of a radius 5 circle, centered at a point depending on k and a pair of base 70 digits. The summand is 0 everywhere else. We can plot the circles on the plane: there are infinitely many circles even in the strip of values [y, y+70], but when k becomes large the circles start to follow a repeating pattern.
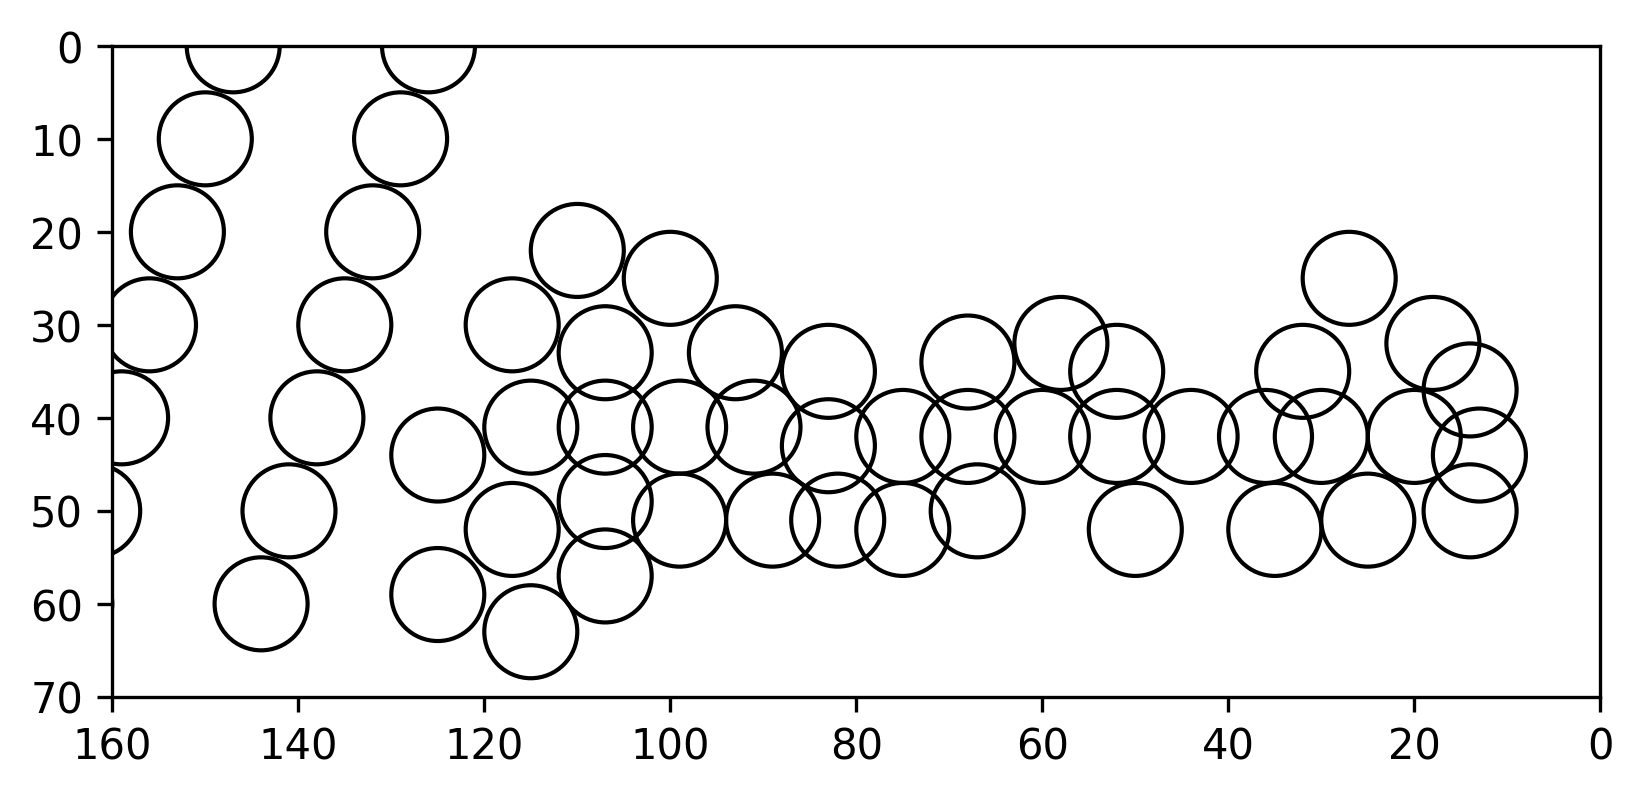
This does not appear to be anything on its own, but the last remaining part of the formula that we haven't used is the 2 ≤ part. A summand is equal to 1 at a point inside a circle, so we should plot the regions that are the intersections of two or more circles
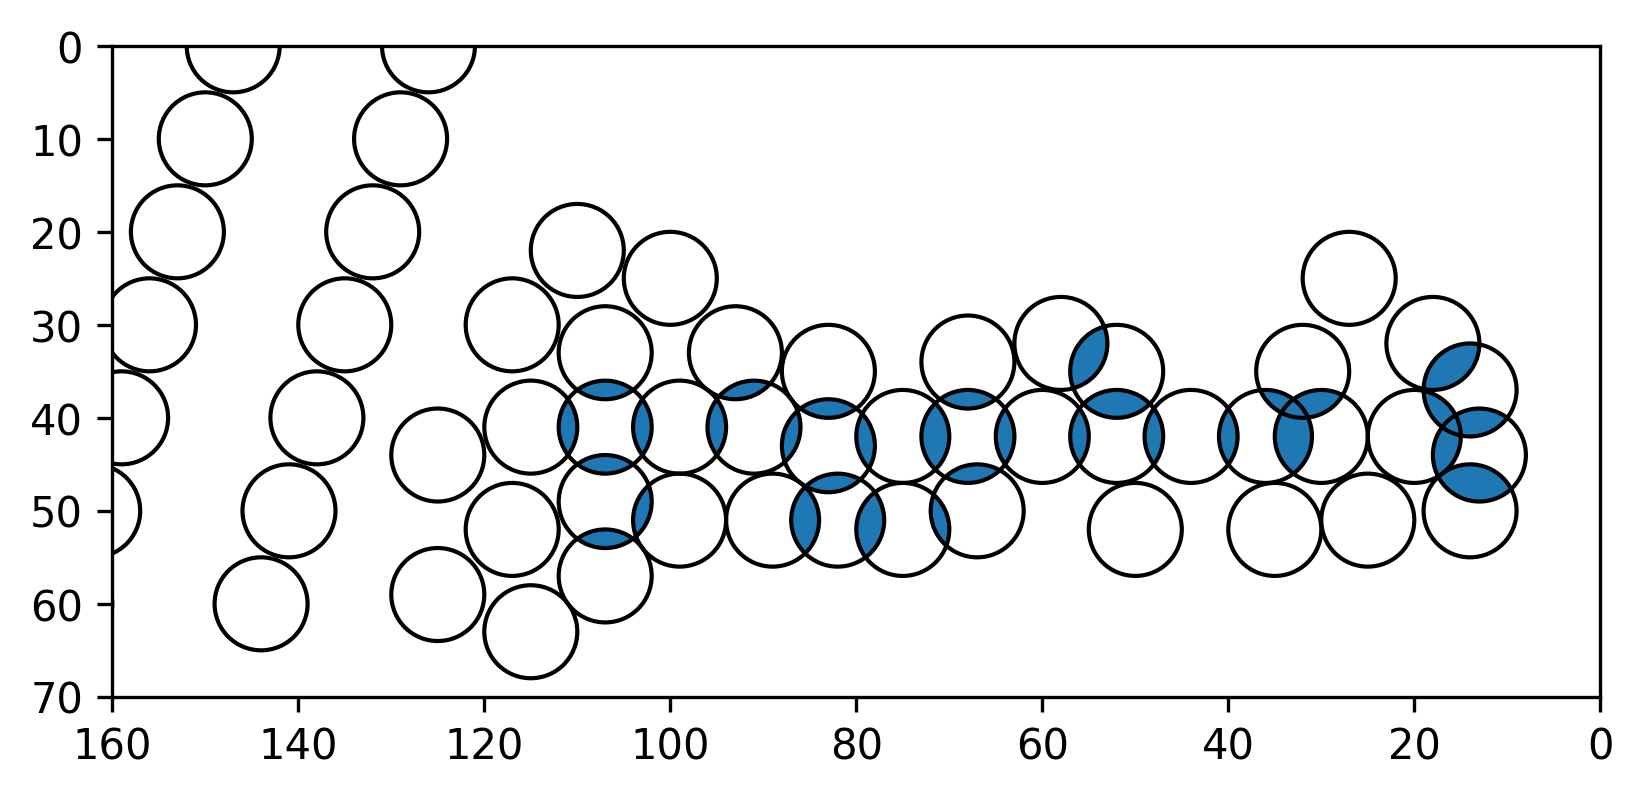
or without the circles themselves.
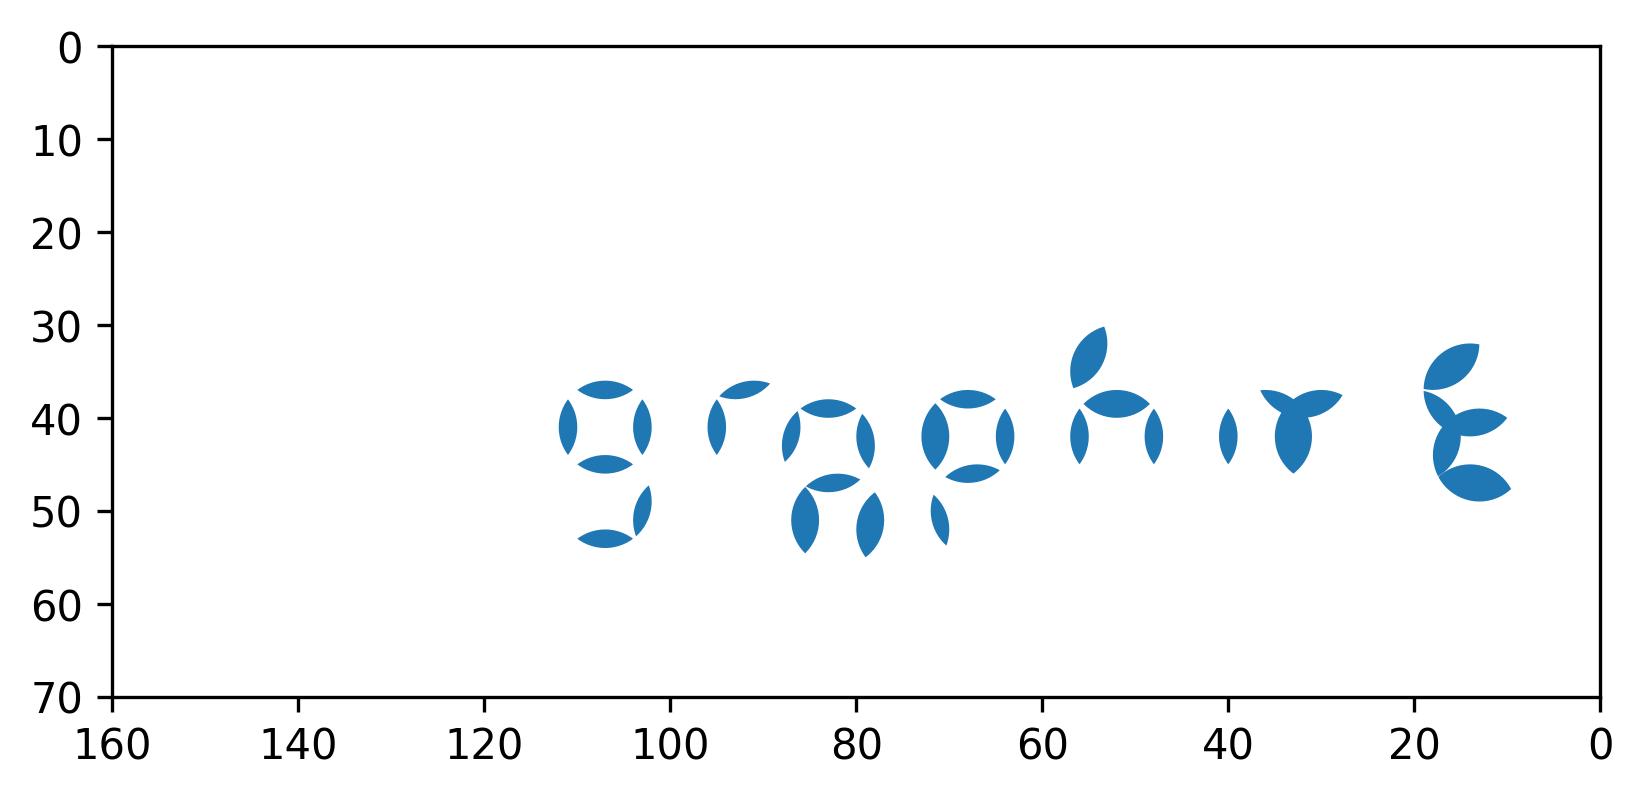
From this graph, we can read off the final answer GRAPHITE.